This guide helps you understand the admin dashboard, interpret health indicators, and troubleshoot common issues.
The admin dashboard provides at-a-glance system health monitoring.
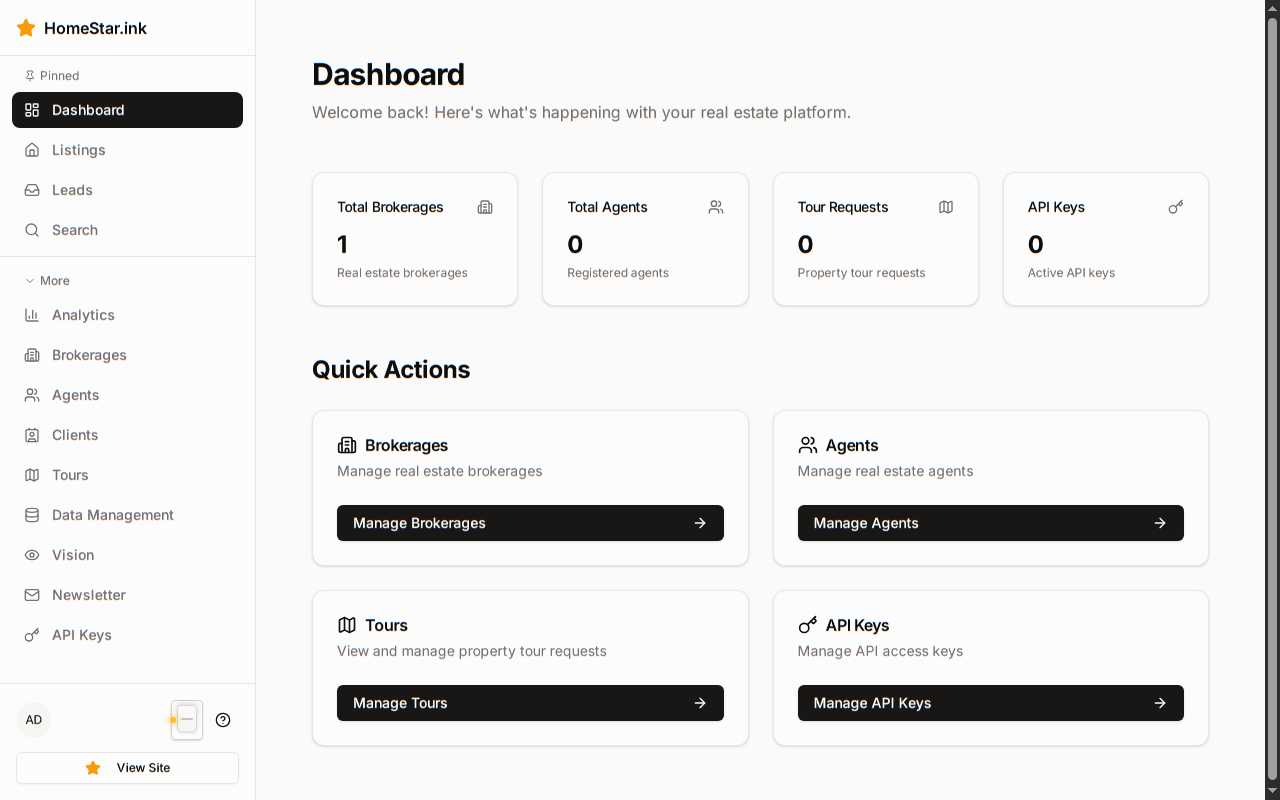
When you open the dashboard, check these four key metrics:
Active Users
Currently logged in users
Normal: 5-50 during business hours
Alert: >100 (possible attack) or 0 (authentication issue)
Total Listings
Properties in the system
Normal: Steady growth or stable
Alert: Sudden drop (data loss?) or spike (duplicate import?)
API Health
External service status
Normal: Green (healthy)
Alert: Yellow (degraded) or Red (down)
Sync Status
MLS data freshness
Normal: <6 hours ago
Alert: >24 hours (sync failure)
Green Normal Operation
The system is successfully syncing with MLSGrid.
What it means:
- Recent API calls succeeded
- Authentication is valid
- Data is being updated
No action needed.
Yellow Degraded
The connection is experiencing issues but still functional.
What it means:
- Slow API responses (>2 seconds)
- Intermittent failures (<10% error rate)
- Partial data updates
Actions:
- Check the Recent Activity log for API errors
- Test MLSGrid API manually using your API key
- Review rate limit status (may be throttled)
- If persistent, schedule a manual sync during off-hours
Red Connection Failed
The system cannot communicate with MLSGrid.
What it means:
- Authentication failure (invalid/expired API key)
- Network connectivity issue
- MLSGrid service outage
Actions:
- Click View Logs to see the specific error
- Verify your MLSGrid API key is valid and active
- Test network connectivity:
curl https://api.mlsgrid.com/v1/Property
- Check MLSGrid status page for outages
- If authentication failed, update the API key in system settings
Green Up to Date
Semantic search is fully functional.
What it means:
- Vision extraction jobs are completing successfully
- Embeddings are current
- Search results include recent listings
No action needed.
Yellow Outdated
Embeddings need to be regenerated.
What it means:
- New properties added but not yet indexed
- Vision extraction job pending or in progress
- Search may miss recent listings
Actions:
- Navigate to Admin → Vision
- Check if an extraction job is already running
- If not, click Start Extraction to process unindexed properties
- Monitor job progress
Red Ollama Unreachable
The vision extraction system is offline.
What it means:
- Ollama server is down or unreachable
- Vision model not loaded
- No embeddings being generated
Actions:
- Check Ollama server status:
curl http://ollama-server:11434/api/version
- Verify the Ollama service is running
- Test model availability:
ollama list
- If down, restart the Ollama service
- Re-run vision extraction once Ollama is back online
Green All Services Operational
All integrations are responding normally.
No action needed.
Yellow Non-Critical Service Degraded
A non-essential integration is experiencing issues.
Examples:
- Analytics service slow
- Email notifications delayed
- Third-party API throttling
Actions:
- Check Recent Activity → Errors Only for details
- Determine if the service is critical for current operations
- If non-critical, monitor and allow time for recovery
- If persistent, contact the service provider
Red Critical Service Down
An essential integration is offline.
Examples:
- Keycloak (authentication) unreachable
- Database connection lost
- Ollama (embeddings) offline
Actions:
- Immediate: Check the service status directly
- Authentication issues: Verify Keycloak is running and accessible
- Database issues: Check database server health and connections
- Embeddings issues: Restart Ollama and verify model availability
- Escalate: If you cannot resolve, contact system administrator or infrastructure team
Green Plenty of Space
Disk usage is under 70%.
No action needed.
Yellow Storage Warning
Disk usage is 70-90%.
Actions:
- Navigate to Admin → Data Management
- Review database size and record counts
- Check for large log files
- Consider cleaning up old data:
- Export and archive old tour requests
- Clear outdated suggestions
- Remove old vision extraction job logs
- Plan for storage expansion if growth is ongoing
Red Storage Critical
Disk usage exceeds 90%.
Actions:
- Immediate: Stop non-critical processes (vision extraction, large data imports)
- Identify largest directories:
du -h --max-depth=1 /data | sort -h
- Clear temporary files and logs
- Export and delete old data (with backups)
- Urgent: Expand storage capacity
- Monitor closely to prevent disk full errors
Navigate to Dashboard → Recent Activity to diagnose issues.
- Click the Activity Type dropdown
- Select Errors Only
- Review the error messages and timestamps
- Click on an error for full details (stack trace, request data)
| Error Type | Possible Cause | Next Steps |
|---|
| 401 Unauthorized | API key expired or revoked | Regenerate API key |
| 429 Too Many Requests | Rate limit exceeded | Reduce request frequency |
| 500 Internal Server Error | Application bug or dependency failure | Check logs, report to developers |
| 503 Service Unavailable | Service overloaded or maintenance | Wait and retry, check service status |
When investigating an issue:
- Note the timestamp of the problem
- Filter Recent Activity to that time range
- Look for related events:
- User login before error (user-triggered issue?)
- Data modification before failure (bad data?)
- API call spike before slowdown (load issue?)
- Expand the time window to see if the pattern repeats
Common administrative tasks accessible from the dashboard:
When to use: New team member needs access, or account needs deactivation
- Click User Management
- Select Add User or find existing user
- Configure role (Admin, Broker, Agent)
- Assign to brokerage (if applicable)
- Save changes
When to use: MLS data is stale (>6 hours) or you need the latest listings immediately
- Click Trigger Manual Sync
- Confirm the action (may take several minutes)
- Monitor Sync Status for completion
- Verify Total Listings increased (if new properties were added)
When to use: Adjusting feature flags, API keys, or configuration
- Click System Settings
- Navigate to the relevant section
- Make your changes carefully (these affect all users)
- Save and test the change in a non-production environment first
When to use: Investigating errors, debugging issues, or auditing activity
- Click View Logs
- Select log type:
- Application Logs — Backend errors and warnings
- Access Logs — HTTP requests and responses
- Audit Logs — User actions and data changes
- Filter by time range and severity
- Download logs for offline analysis if needed
- Check Active Users — Are others logged in? (System-wide issue vs. user-specific)
- Review Recent Activity → User Events — Any failed login attempts for this user?
- Check API Services → Keycloak — Is authentication service healthy?
- Test login yourself with a test account
- If Keycloak is down, restart the service
- If user-specific, verify their account is active and not locked
- Check Sync Status — When was the last MLS data sync?
- If stale, trigger a Manual Sync
- Check Search Index health — Are embeddings up to date?
- If outdated, navigate to Admin → Vision and start an extraction job
- Monitor both sync and extraction jobs to completion
- Test search again once both are complete
- Filter Recent Activity → Errors Only
- Identify the most common error type
- Check if errors are concentrated:
- Single user — User-specific issue (bad workflow, permissions)
- Single endpoint — Service issue (API down, bug)
- Across the board — System-wide issue (overload, network)
- Address the root cause based on concentration
- Monitor error rate after fix to confirm resolution