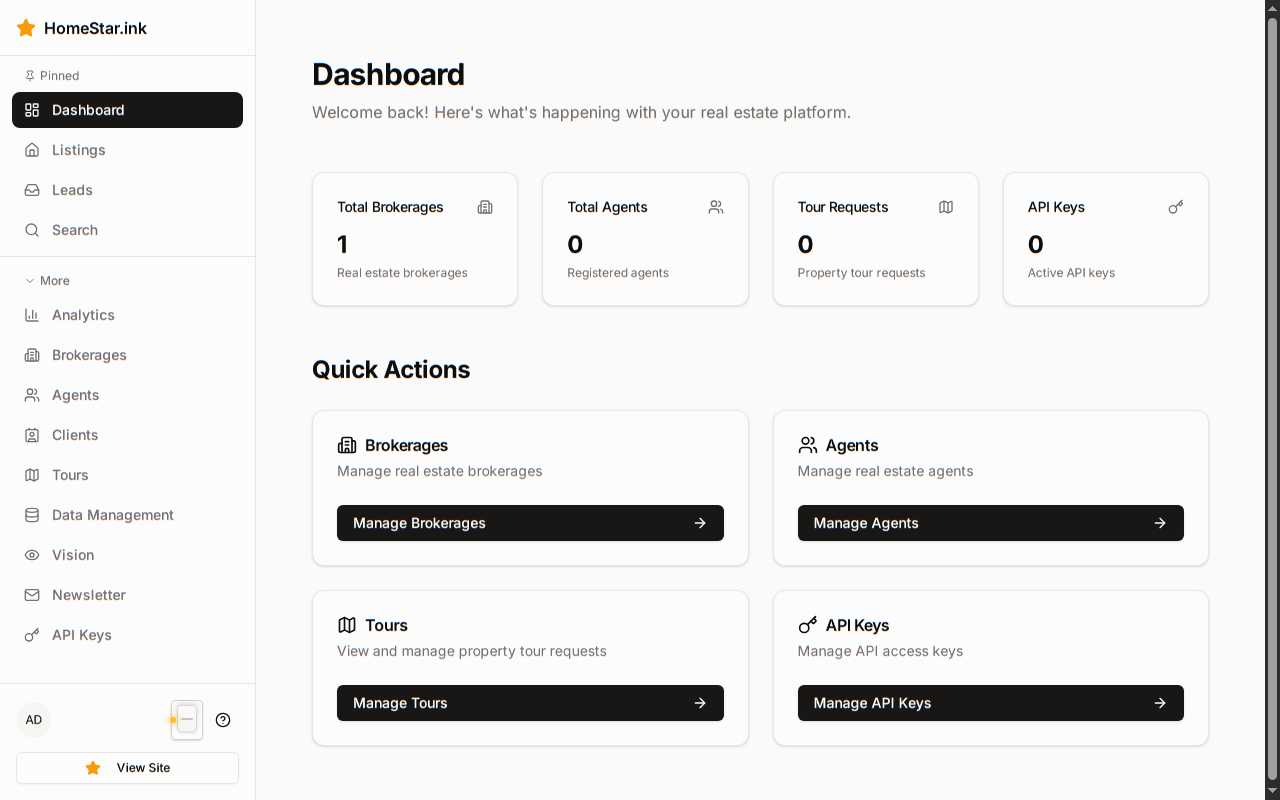
Dashboard Metrics Reference
Complete reference for admin dashboard metrics, health indicators, and activity tracking.

System Metrics
Section titled “System Metrics”Active Users
Section titled “Active Users”Definition: Number of users currently logged in with active sessions
Data Type: Integer (real-time count)
Calculation: Count of sessions with last_activity within the past 15 minutes
Use Cases:
- Monitoring concurrent usage
- Capacity planning
- Detecting unusual spikes
Total Listings
Section titled “Total Listings”Definition: Total number of properties in the database
Data Type: Integer
Calculation: Count of all records in the properties table
Includes:
- Active listings
- Pending listings
- Sold properties (if retention policy includes them)
Excludes:
- Soft-deleted properties
- Draft listings (if applicable)
API Health
Section titled “API Health”Definition: Status of external service integrations
Possible Values:
- Healthy — All services responding normally
- Degraded — Some services experiencing issues
- Down — Critical service unavailable
Monitored Services:
- MLSGrid API endpoint
- Ollama vision server
- Keycloak authentication
- Database connection
Health Check Frequency: Every 60 seconds
Sync Status
Section titled “Sync Status”Definition: Freshness of MLS data
Display Format: “Last synced X hours ago” or timestamp
Data Type: DateTime (last successful sync)
Color Coding:
- Fresh — Synced within 6 hours
- Stale — Synced 6-24 hours ago
- Critical — Synced >24 hours ago
Related Actions: Manual sync trigger button appears when status is stale
Health Indicators
Section titled “Health Indicators”MLS Connection
Section titled “MLS Connection”Monitors connectivity to the MLSGrid API.
| Status | Color | Description |
|---|---|---|
| Green | Success | Active sync, successful API responses |
| Yellow | Warning | Delayed responses, intermittent failures |
| Red | Error | Connection timeout, authentication failure |
Diagnostic Data:
- Last successful API call timestamp
- Current error rate (if any)
- Response time average (ms)
Search Index
Section titled “Search Index”Monitors the semantic search embedding system.
| Status | Color | Description |
|---|---|---|
| Green | Success | Embeddings up-to-date, vision extraction running |
| Yellow | Warning | Embeddings outdated, extraction pending |
| Red | Error | Ollama unreachable, no embeddings generated |
Diagnostic Data:
- Percentage of properties with embeddings
- Last vision extraction job timestamp
- Pending extraction queue size
API Services
Section titled “API Services”Monitors external integrations and dependencies.
| Status | Color | Description |
|---|---|---|
| Green | Success | All integrations responding normally |
| Yellow | Warning | Non-critical service degraded (e.g., analytics) |
| Red | Error | Critical service down (e.g., authentication) |
Monitored Services:
- Keycloak (authentication)
- Ollama (embeddings)
- External APIs (if configured)
Storage
Section titled “Storage”Monitors disk usage for database and media storage.
| Status | Color | Description |
|---|---|---|
| Green | Success | <70% usage |
| Yellow | Warning | 70-90% usage |
| Red | Error | >90% usage |
Diagnostic Data:
- Total disk space
- Used space
- Available space
- Percentage used
Activity Types
Section titled “Activity Types”User Logins
Section titled “User Logins”Data Captured:
- User ID and email
- Login timestamp (ISO 8601)
- IP address
- User agent
- Authentication method (OIDC, API key)
Display Format:
John Doe (john@example.com) logged in2024-12-28 10:30:15 from 203.0.113.42User Logouts
Section titled “User Logouts”Data Captured:
- User ID and email
- Logout timestamp
- Session duration
- Logout type (manual, timeout, forced)
Display Format:
Jane Smith (jane@example.com) logged outSession duration: 2h 15mData Modifications
Section titled “Data Modifications”Data Captured:
- Entity type (property, agent, brokerage, etc.)
- Action (created, updated, deleted)
- Entity ID
- User who made the change
- Timestamp
- Changed fields (summary)
Display Format:
Sarah Admin updated Property #123456Changed: price ($500,000 → $485,000)2024-12-28 14:22:00API Calls
Section titled “API Calls”Data Captured:
- Endpoint path
- HTTP method
- Response status code
- Response time (ms)
- API key ID (if authenticated)
- Timestamp
Display Format:
GET /api/v1/properties → 200 OK (45ms)API Key: CRM Integration2024-12-28 16:45:30Error Events
Section titled “Error Events”Data Captured:
- Error type (4xx, 5xx, application error)
- Error message
- Stack trace (if applicable)
- User/API key associated
- Request details
- Timestamp
Display Format:
500 Internal Server ErrorPOST /api/v1/propertiesError: Database connection timeoutUser: Admin (admin@example.com)2024-12-28 18:10:00Activity Filtering
Section titled “Activity Filtering”Time Ranges
Section titled “Time Ranges”Available filters in the dashboard:
| Filter | Description |
|---|---|
| Last Hour | Events in past 60 minutes |
| Last 24 Hours | Events in past day |
| Last 7 Days | Events in past week |
| Custom Range | User-specified start/end dates |
Activity Categories
Section titled “Activity Categories”Filter by event type:
- All Activity — No filtering
- User Events — Logins, logouts, profile changes
- Data Changes — Create, update, delete operations
- API Activity — External API calls
- Errors Only — Failed requests, exceptions
Severity Levels
Section titled “Severity Levels”Filter by importance:
| Level | Badge | Examples |
|---|---|---|
| Info | Info | User login, data view |
| Warning | Warning | Rate limit approach, slow query |
| Error | Error | Failed API call, exception |
| Critical | Critical | Service down, data loss |
Metric Retention
Section titled “Metric Retention”How long different metrics are stored:
| Metric Type | Retention Period |
|---|---|
| Real-time Metrics | 24 hours (raw data) |
| Aggregated Metrics | 90 days (hourly) |
| Activity Logs | 90 days |
| Error Logs | 180 days |
| Audit Logs | 1 year |
Export Formats
Section titled “Export Formats”Dashboard data can be exported in:
| Format | Use Case |
|---|---|
| CSV | Spreadsheet analysis |
| JSON | Programmatic processing |
| Management reports |
Related Documentation
Section titled “Related Documentation”- Monitor System Health — Interpreting indicators and troubleshooting